While preparing for my talk at the Joint Statistical Meetings in Montreal this week, I had the occasion to consider again the
Earliest Living Histogram that I posted in 2008. This image appeared on page 450 of
Popular Science Monthly, September 1901 in a paper "The Statistical Study of Evolution," by
C.B. Davenport. Forty University of Chicago students are arranged by height in bins of two inch width. When viewed from above we see what was much later called a "living histogram" of the heights of this sample of men. It is described in more detail in
Graphical Methods for Presenting Facts (1914) (Figure 141) by W.C. Brinton where, on page 165, he writes:
In Fig. 141 a group of men have been arranged in different rows. There is only one man in the shortest class at the left, and only one man in each of the tallest two classes at the right. Most of the men are of that height shown by the row to the right of the center of the diagram. A glance at the photograph taken looking down on this group of men shows that there are more men shorter than the most frequent height than there are men taller.
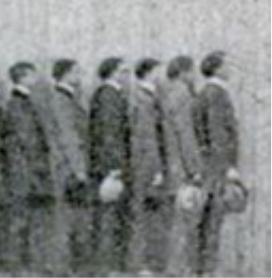
Davenport's original publication of this photograph also contains another image of the forty students:
Davenport says they are "arranged (approximately) in order of height." Examine the tallest few students shown here:
Note the shading of the hats that the tallest five men are holding: Gray, White, Black, White, and Black, reading from tallest downward (right to left). Now consider their arrangement in classes by height in the image above. Note that the five men on the
far left are now wearing hats with shading Gray, White, Black, White, and Black.
The histogram image is reversed!
The taller men are shown on the left and the shorter on the right. This is exactly the reverse of the description given by Brinton and it reverses his reasoning and conclusions about the frequency of tall and short men in this sample. But there is more evidence. Reversing this image along a properly oriented and indicated number line we get the image below along with counts of the men standing in two of the histogram classes.
The five numbered men in dark hats, on the right, stand in a row of about the same extent as the seven numbered, smaller men in the row on the left. The men on the right are not just taller but also broader, and the smaller men on the left take up much less space in this regard. Another indication that this is the proper view of this histogram. The original published histogram should be reversed.
The correctly oriented Earliest Living Histogram is shown below:


No comments:
Post a Comment