looking for a useful search strategy to find Martin Handford's elusive cartoon character. Blatt plotted the horizontal and vertical page location of Waldo in 68 pictures in, what he calls, the seven "primary" Where's Waldo books. He claims to have sat for three hours with a tape measure in a Barnes & Noble bookstore and measured Waldo's location on each 20" X 12.5" two-page spread. The image above shows these locations and two horizontal bands of 1.5" each: one three inches from the bottom of the page and the other seven inches from the bottom. Blatt found that Waldo can be found in these bands in 53% (36) of the 68 images.
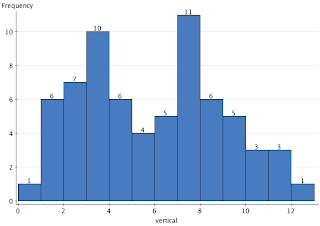
We can see the higher frequency of occurrence in bands by finding the marginal histograms from digitized locations in Blatt's scatterplot (data shown below). Here is the marginal histogram of the vertical locations of Waldo. The regions found by Blatt stand our prominently in the two modal peaks in the histogram.
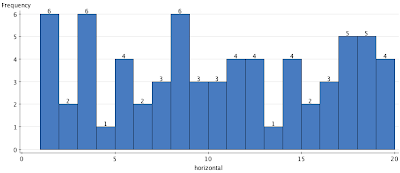
Horizontally there is a less prominent patten of the locations across the two-page spread.
Perhaps we could improve on the two-vertical-strips strategy by concentrating on the far left and far right of the two-page spread with then a glance just left of center?
Here are the data:
| horizontal | vertical | horizontal | vertical | horizontal | vertical | horizontal | vertical |
| 1.02 | 11.97 | 9.52 | 7.21 | 11.79 | 6.22 | 8.8 | 2.95 |
| 7.78 | 10.22 | 10.51 | 7.71 | 14.78 | 5.72 | 12.57 | 3.71 |
| 8.51 | 9.99 | 11.52 | 7.97 | 14.51 | 4.96 | 17.76 | 3.97 |
| 9.26 | 9.46 | 11.29 | 6.95 | 18.03 | 5.43 | 18.03 | 4.21 |
| 10.77 | 10.48 | 12.19 | 7.77 | 18.75 | 5.43 | 19.01 | 4.47 |
| 11.99 | 11.48 | 12.51 | 8.24 | 1.8 | 3.97 | 16.81 | 2.95 |
| 13.27 | 10.48 | 12.51 | 7.48 | 1.31 | 3.45 | 1.04 | 2.72 |
| 16.26 | 11.21 | 14.51 | 8.21 | 2.26 | 3.18 | 1.54 | 1.93 |
| 19.48 | 12 | 14.25 | 7.21 | 3.77 | 4.21 | 1.54 | 1.43 |
| 16.26 | 9.99 | 15.62 | 7.48 | 3.51 | 3.45 | 3.28 | 1.2 |
| 17.5 | 9.99 | 17.24 | 7.48 | 3.8 | 3.45 | 7.29 | 1.93 |
| 17.74 | 9.46 | 18.49 | 7.21 | 5.31 | 3.97 | 8.27 | 1.2 |
| 15.5 | 8.97 | 19.25 | 7.48 | 4.79 | 2.98 | 8.53 | 0.44 |
| 5.78 | 8.24 | 2.76 | 6.75 | 5.54 | 3.21 | 10.54 | 2.45 |
| 6.76 | 7.97 | 3.8 | 6.98 | 6.76 | 4.44 | 17.5 | 2.69 |
| 7.52 | 8.47 | 3.28 | 5.96 | 8.27 | 4.21 | 19.48 | 2.45 |
| 8.51 | 8.47 | 5.54 | 6.72 | 9.03 | 3.45 | 18.98 | 1.93 |


1 comment:
If you are wondering what a scatter plot shows, the answer is simpler than you think. The scatter plot also has other names, such as a scatter plot, scatter plot, and correlation plot.
https://ppcexpo.com/blog/scatter-plot-examples
Post a Comment