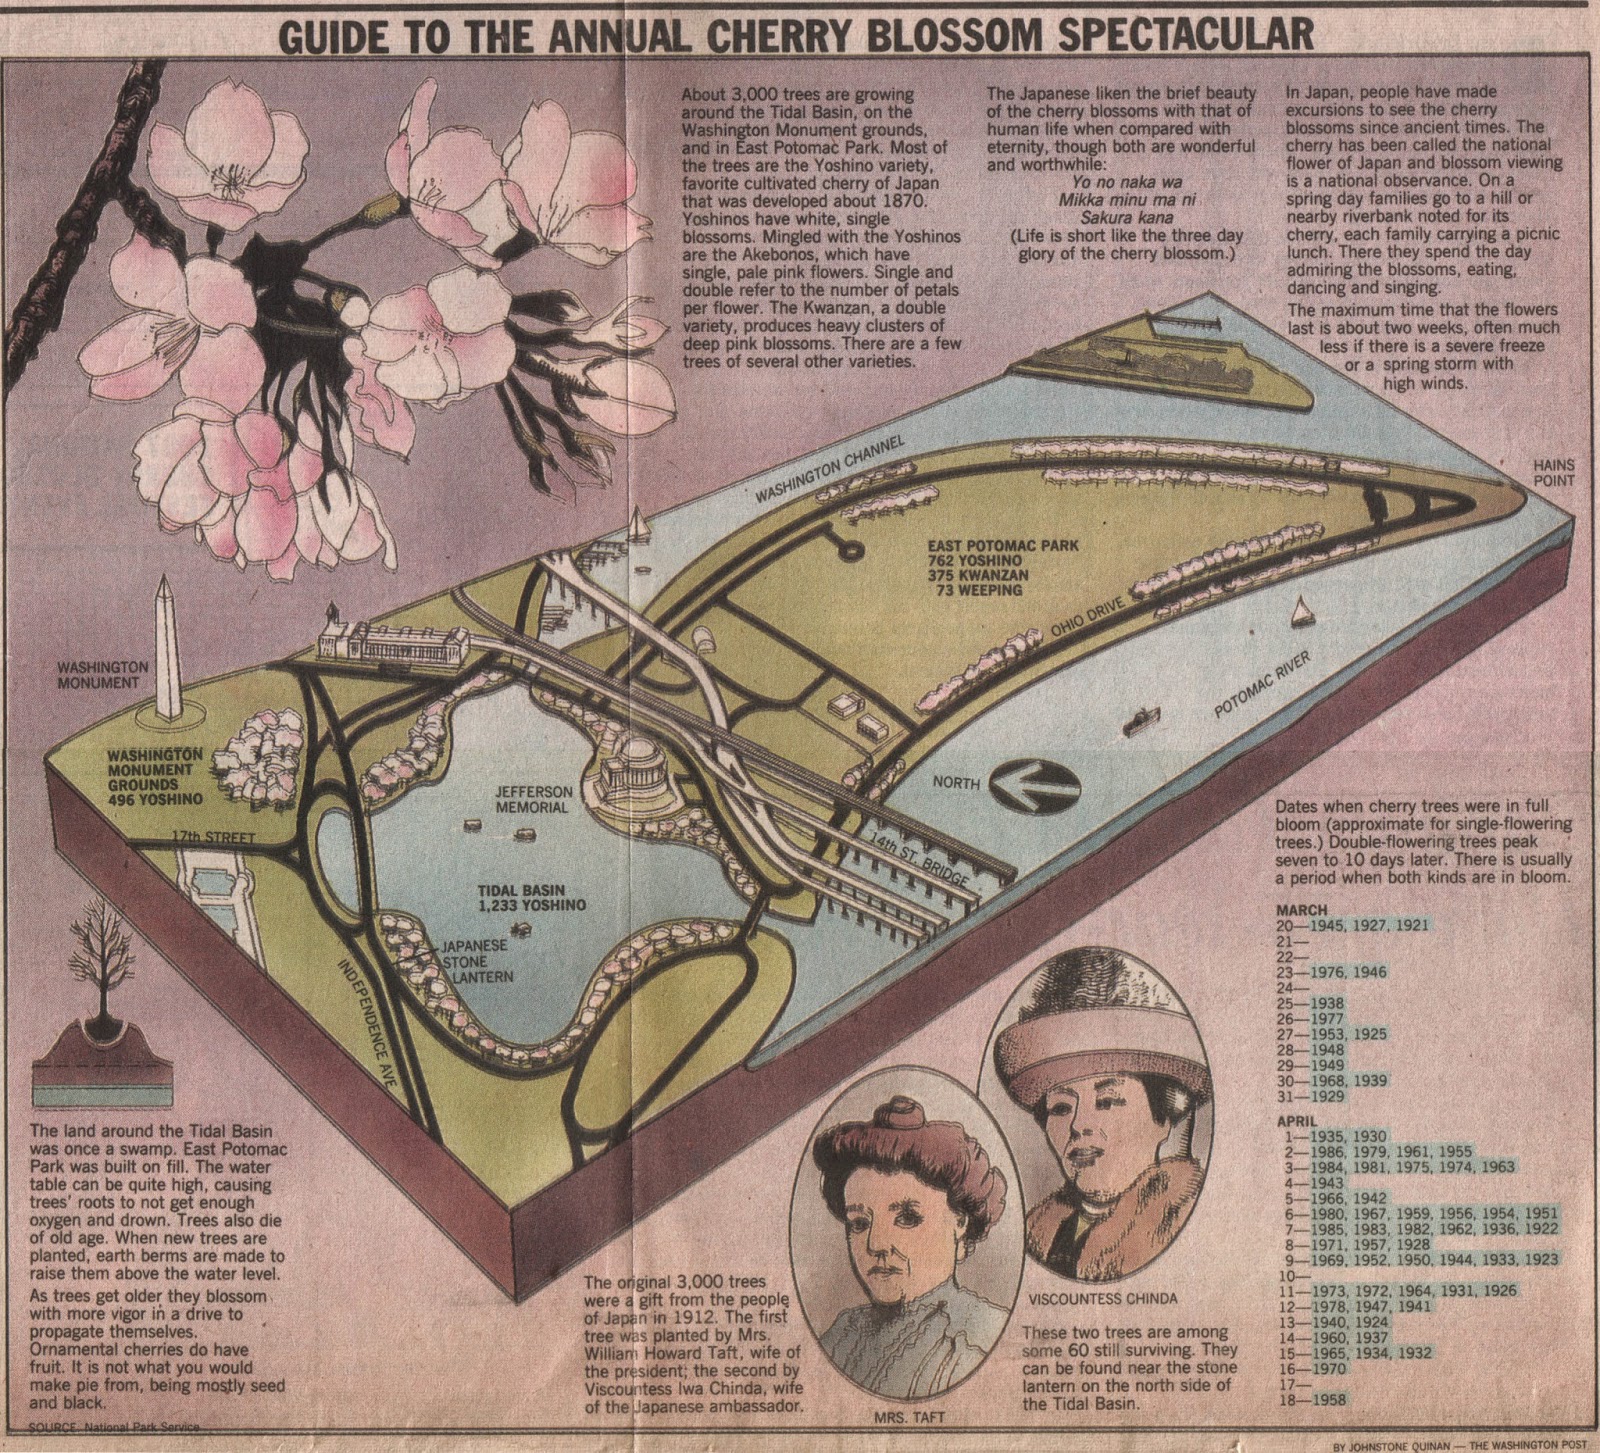
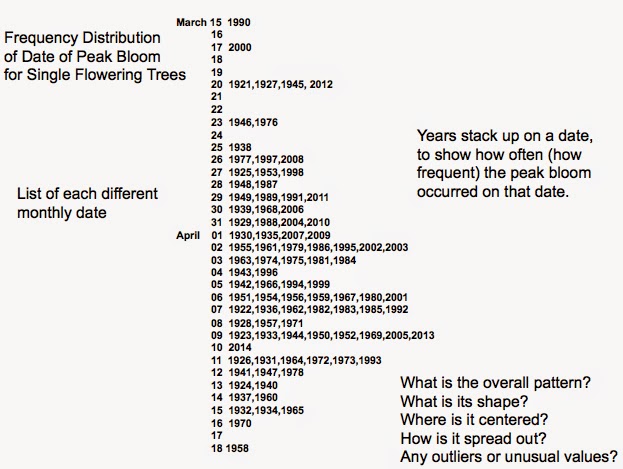
It happened this past week. The death of one of my favorite examples. This one about an iconic Washington, DC event: The National Cherry Blossom Festival. Since 1912, Washington, DC has celebrated the arrival of spring with this festival. But the arrival of the blossoms doesn't always correspond with the the date of the festival. Regular records of the monthly date when the Washington, DC cherry blossoms are at peak bloom have been collected by the National Park Service (NPS) since 1921. I've posted other uses of the cherry blossoms here and here. The graphic above is from the Washington Post on March 27, 1987. It shows the frequency distribution of those monthly dates as a stem and leaf diagram. The stems are the monthly dates. The leaves are the years when that date was noted by the NPS as the peak bloom. This is the date when 70% of the trees are in full bloom. Like many frequency distributions it is sparse for the early blooming in mid-March, becoming more frequent towards the end of March and into the first few weeks of April, and then finally becoming sparse again towards mid-April. None of this is unusual or surprising. Unusual outliers in the peak blooming dates might be found in the early or late times, (as I have often taught my students). But something more surprising hides in plain sight near the most frequently occurring peak dates. Since those regular records began in 1921, a peak bloom was never noted on April 10. The surrounding dates of April 9 and April 11 have been noted as peak blooms several times, but not April 10. For this 1987 graphic, that was 65 years of missing April 10. This surprising gap in a high frequency region of the distribution is surprising. In my class in Basic Statistics we talk about possible causes: Is April 10 a commemorative date for the Park Service? Are they otherwise occupied on April 10? Do they take April 10 off? or Is this just a result of randomness?
I have kept track this for the past 27 years, and through 2013, this pattern has stayed. Until, 2014! This past week the peak bloom has recorded by the National Park Service to be on April 10. The first such time in 94 years. My longtime example has died. Randomness has filled in the gap.
Here is a view of my classroom presentation slide with the new offending date filled in.


1 comment:
Lovely
Post a Comment