We've previously seen the
distribution of initial letters in English words. We've also seen the
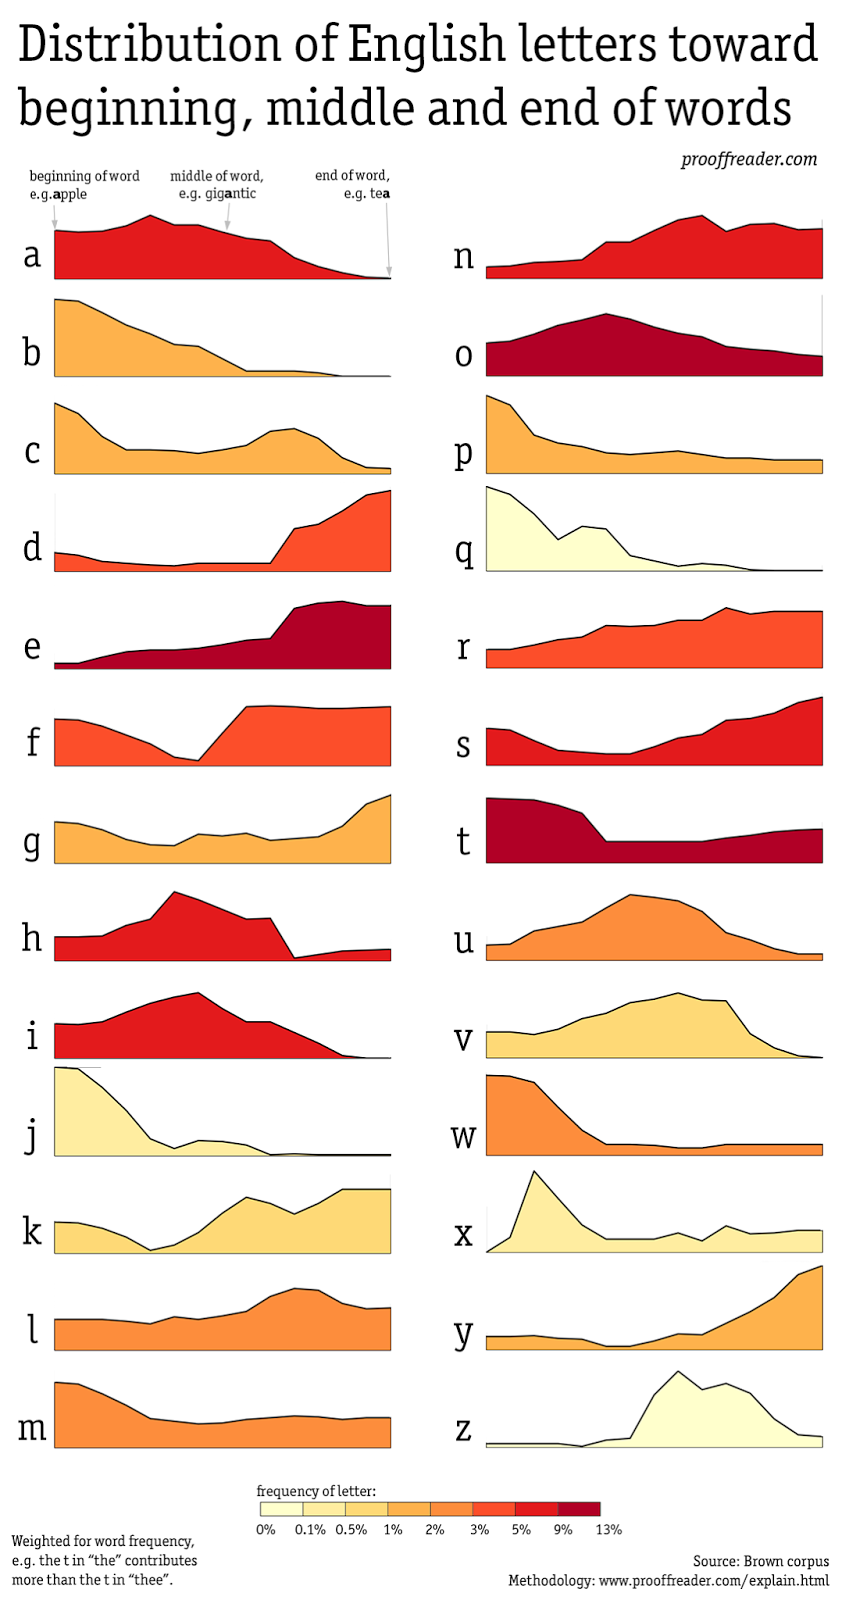
distribution of letter usage in the game of Scrabble. Here is a more complete distribution of letters developed by
David Taylor on
Prooffreader.com. His distributions are first color coded from pale yellow to deep red indicating the frequency of letter usage from least to most. Next he uses 15
ordinal bins of the relative positions of the letters that begin a word, through the middle of the word, and then the ending letters. Here is his example of how words of varying length were handled.
The 4-letter word "four" is apportioned here into only 5 bins. These bin percentages are accumulated across all the words in the
Brown corpus via the
Natural Language Toolkit. What remains is deciding what aspect of these accumulated percentages of ordinal data to plot to provide an informative display. If the raw percentages are used, comparisons are difficult between frequently used letters like "a" and rarely used ones like "z".
Logs were another possibility he considered, but these add their own interpretation problems.
Normalizing the y-axis so that 100% represents each letter's greatest frequency is another approach. But he argues this makes interpretation difficult since the vertical scales really are not comparable.
And yet another approach is creating an integrated density so that each letter has a density curve with the same area. I think this works best, but he argues that for a letter like "z" with a narrower and taller central density compared to "a" with a broader and lower density, we give more weight to "z", viewing it as having more ink.
In the end he averaged these last two approaches, normalization and integration, to produce his curves. Check out more of his methods for these graphs at
prooffreaderplus.


No comments:
Post a Comment